Getting Started with Open Telemetry operator on Kubernetes
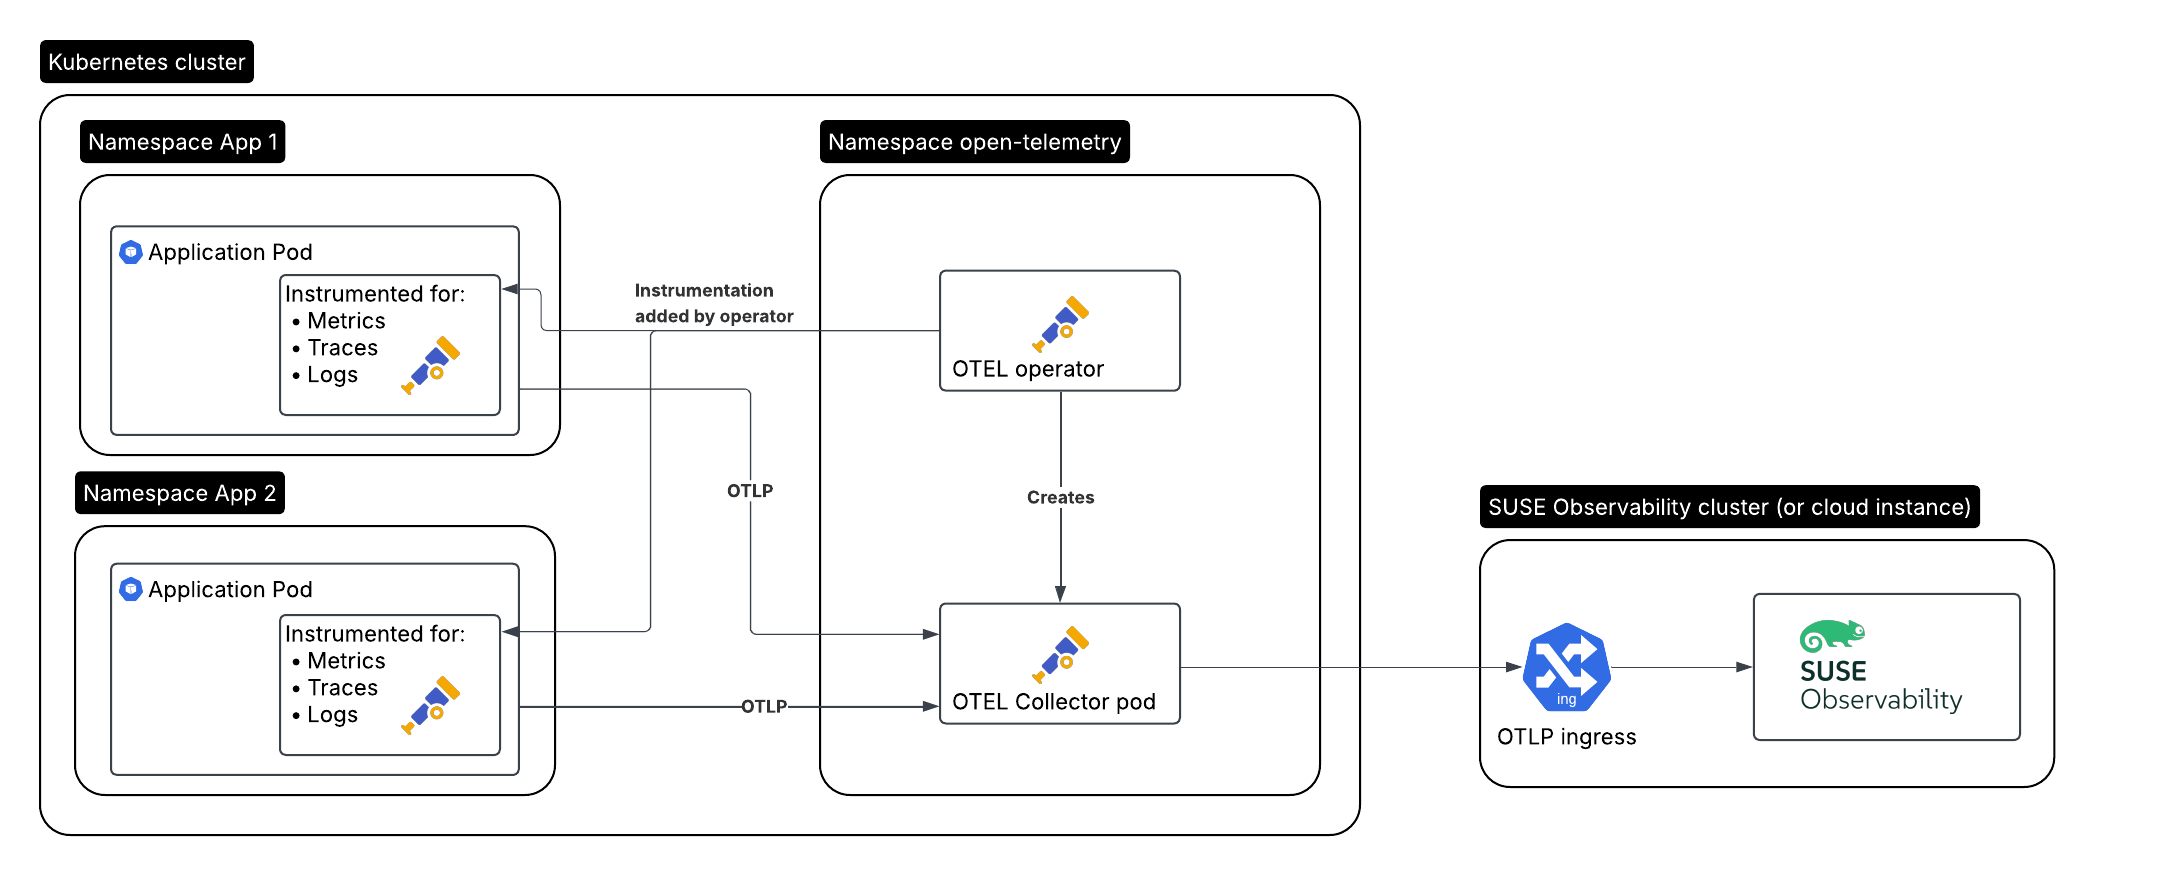
Here is the setup we’ll be creating, for an application that needs to be monitored:
-
The monitored application / workload running in cluster A, auto-instrumented by the operator
-
The Open Telemetry operator in cluster A
-
A collector created by the operator
-
SUSE Observability running in cluster B, or SUSE Cloud Observability
Install the operator
The Open Telemetry operator offers some extra features over the normal Kubernetes setup:
-
It can auto-instrument your application pods for supported languages (Java, .NET, Python, Golang, Node.js), without having to modify the applications or docker images at all
-
It can be dropped in as a replacement for the Prometheus operator and start scraping Prometheus exporter endpoints based on service and pod monitors
Create a Service Token
There are two ways to create a service token:
-
SUSE Observability UI - open the main menu by clicking in the top left of the screen and go to
StackPacks>Open Telemetry. If you haven’t done so before, click theINSTALLbutton. Click theCREATE NEW SERVICE TOKENbutton and copy the value onto your clipboard. -
SUSE Observability CLI - see Manage service tokens
The service token value must be used where the instructions below mention <SERVICE_TOKEN>.
Create the namespace and a secret for the service token
We’ll install in the open-telemetry namespace and use the service token:
kubectl create namespace open-telemetry
kubectl create secret generic open-telemetry-collector \
    --namespace open-telemetry \
    --from-literal=API_KEY='<SERVICE_TOKEN>'
Configure & Install the operator
We install the operator with the Helm chart provided by the SUSE Application Collection. Please check their authentication guide to configure Application Collection OCI credentials in your Kubernetes cluster.
By default, OpenTelemetry Operator for Kubernetes depends on cert-manager to issue and renew the self-signed certificate for the webhook component. You can install it from Application Collection if you don’t have it installed or disable the cert-manager dependency entirely as we do in the command below.
Install the operator using Application Collection image pull secret named application-collection (Application Collection authentication guide):
helm upgrade --install opentelemetry-operator oci://dp.apps.rancher.io/charts/opentelemetry-operator \
  --namespace open-telemetry \
  --set global.imagePullSecrets={application-collection} \
  --set manager.createRbacPermissions=true \
  --set admissionWebhooks.certManager.enabled=false \
  --set admissionWebhooks.autoGenerateCert.enabled=true
The 2 admissionWebhooks values disable cert-manager and enable the operator to generate its own self-signed certificate for the webhook component. The manager.createRbacPermissions option creates the necessary RBAC permissions for the operator to manage the OpenTelemetryCollector and Instrumentation custom resources.
The Open Telemetry collector
The operator manages one or more collector deployments via a Kubernetes custom resource of kind OpenTelemetryCollector. We’ll create one using the same configuration as used in the Kubernetes getting started guide.
To be able to pull the Collector image from Application Collection, you first need to define a service account with the imagePullSecrets attribute to be able to pull images from Application Collection and attach it to the Collector CR via the spec.serviceAccount attribute:
kubectl create serviceaccount --namespace open-telemetry otel-collector
kubectl patch serviceaccount --namespace open-telemetry otel-collector --patch '{"imagePullSecrets": [{"name": "application-collection"}]}'
Create a collector.yaml:
Make sure to replace <otlp-suse-observability-endpoint:port> with your OTLP endpoint (see OTLP API for your endpoint) and insert the name for your Kubernetes cluster instead of <your-cluster-name>:
|
A service token must be used instead of api key as they are synonymous. Any environment variable that continues to refer to API_KEY is for backwards compatibility. |
apiVersion: opentelemetry.io/v1beta1
kind: OpenTelemetryCollector
metadata:
  name: otel-collector
spec:
  mode: deployment
  env:
  - name: MY_POD_IP
    valueFrom:
      fieldRef:
        apiVersion: v1
        fieldPath: status.podIP
  envFrom:
  - secretRef:
      name: open-telemetry-collector
  serviceAccount:  otel-collector
  config:
    receivers:
      otlp:
        protocols:
          grpc:
            endpoint: 0.0.0.0:4317
          http:
            endpoint: 0.0.0.0:4318
      # Scrape the collectors own metrics
      prometheus:
        config:
          scrape_configs:
          - job_name: opentelemetry-collector
            scrape_interval: 30s
            static_configs:
            - targets:
              - ${env:MY_POD_IP}:8888
              labels:
                k8s.pod.ip: ${env:MY_POD_IP}
    extensions:
      health_check:
        endpoint: ${env:MY_POD_IP}:13133
      # Use the service token from the env for authentication
      bearertokenauth:
        scheme: SUSEObservability
        token: "${env:API_KEY}"
    exporters:
      debug: {}
      nop: {}
      otlp/suse-observability:
        auth:
          authenticator: bearertokenauth
        # Put in your own otlp endpoint, for example otlp-suse-observability.my.company.com:443
        endpoint: <otlp-suse-observability-endpoint:port>
        compression: snappy
    processors:
      memory_limiter:
        check_interval: 5s
        limit_percentage: 80
        spike_limit_percentage: 25
      k8sattributes:
        extract:
          labels:
          - from: pod
            key_regex: (.*)
            tag_name: $$1
          metadata:
          - k8s.namespace.name
          - k8s.deployment.name
          - k8s.statefulset.name
          - k8s.daemonset.name
          - k8s.cronjob.name
          - k8s.job.name
          - k8s.node.name
          - k8s.pod.name
          - k8s.pod.uid
          - k8s.pod.start_time
        passthrough: false
        pod_association:
        - sources:
          - from: resource_attribute
            name: k8s.pod.ip
        - sources:
          - from: resource_attribute
            name: k8s.pod.uid
        - sources:
          - from: connection
      batch: {}
      resource:
        attributes:
        - key: k8s.cluster.name
          action: upsert
          # Insert your own cluster name
          value: <your-cluster-name>
        - key: service.instance.id
          from_attribute: k8s.pod.uid
          action: insert
          # Use the k8s namespace also as the open telemetry namespace
        - key: service.namespace
          from_attribute: k8s.namespace.name
          action: insert
    connectors:
      # Generate metrics for spans
      spanmetrics:
        metrics_expiration: 5m
        namespace: otel_span
    service:
      extensions: [ health_check,  bearertokenauth ]
      pipelines:
        traces:
          receivers: [otlp]
          processors: [memory_limiter, k8sattributes, resource, batch]
          exporters: [debug, spanmetrics, otlp/suse-observability]
        metrics:
          receivers: [otlp, spanmetrics, prometheus]
          processors: [memory_limiter, k8sattributes, resource, batch]
          exporters: [debug, otlp/suse-observability]
        logs:
          receivers: [otlp]
          processors: []
          exporters: [nop]
      telemetry:
        metrics:
          readers:
            - pull:
                exporter:
                  prometheus:
                    host: ${env:MY_POD_IP}
port: 8888|
Use the same cluster name as used for installing the SUSE Observability agent if you also use the SUSE Observability agent with the Kubernetes stackpack. Using a different cluster name will result in an empty traces perspective for Kubernetes components and will overall make correlating information much harder for SUSE Observability and your users. |
Now apply this collector.yaml in the open-telemetry namespace to deploy a collector:
kubectl apply --namespace open-telemetry -f collector.yamlThe collector offers a lot more options for receivers, processors, and exporters. For more details see our collector page. For production usage often large amounts of spans are generated and you will want to start setting up sampling.
Auto-instrumentation
Configure auto-instrumentation
Now we need to tell the operator how to configure the auto instrumentation for the different languages using another custom resource, of kind Instrumentation. It is mainly used to configure the collector that was just deployed as the telemetry endpoint for the instrumented applications.
It can be defined in a single place and used by all pods in the cluster, but it is also possible to have a different Instrumentation in each namespace. We’ll be doing the former here. Note that if you used a different namespace or a different name for the otel collector the endpoint in this file needs to be updated accordingly.
Create an instrumentation.yaml (you can remove all the languages that you don’t need) with the following content:
apiVersion: opentelemetry.io/v1alpha1
kind: Instrumentation
metadata:
  name: otel-instrumentation
spec:
  exporter:
    # default endpoint for the instrumentation
    endpoint: http://otel-collector-collector.open-telemetry.svc.cluster.local:4317
  propagators:
    - tracecontext
    - baggage
  defaults:
    # To use the standard app.kubernetes.io/ labels for the service name, version and namespace:
    useLabelsForResourceAttributes: true
  python:
    env:
      # Python autoinstrumentation uses http/proto by default, so data must be sent to 4318 instead of 4317.
      - name: OTEL_EXPORTER_OTLP_ENDPOINT
        value: http://otel-collector-collector.open-telemetry.svc.cluster.local:4318
  dotnet:
    env:
      # Dotnet autoinstrumentation uses http/proto by default, so data must be sent to 4318 instead of 4317.
      - name: OTEL_EXPORTER_OTLP_ENDPOINT
        value: http://otel-collector-collector.open-telemetry.svc.cluster.local:4318
  go:
    env:
      # Go autoinstrumentation uses http/proto by default, so data must be sent to 4318 instead of 4317.
      - name: OTEL_EXPORTER_OTLP_ENDPOINT
        value: http://otel-collector-collector.open-telemetry.svc.cluster.local:4318
  sampler:
    type: parentbased_traceidratio
    argument: "1"
Now apply the instrumentation.yaml in the namespace of your application:
kubectl apply -f instrumentation.yamlGo auto-instrumentation uses eBPF and needs to be enabled on the operator. To enable it (re)deploy the operator with --set manager.autoInstrumentation.go.enabled=true:
helm upgrade --install opentelemetry-operator oci://dp.apps.rancher.io/charts/opentelemetry-operator \
  --namespace open-telemetry \
  --set global.imagePullSecrets={application-collection} \
  --set manager.createRbacPermissions=true \
  --set admissionWebhooks.certManager.enabled=false \
  --set admissionWebhooks.autoGenerateCert.enabled=true \
--set manager.autoInstrumentation.go.enabled=true|
Go auto-instrumentation requires elevated permissions. These permissions are set automatically by the operator when opting into Go auto-instrumentation: |
Enable auto-instrumentation for a pod
To instruct the operator to auto-instrument your application pods we need to add an annotation to the pod:
-
Java:
instrumentation.opentelemetry.io/inject-java: true -
NodeJS:
instrumentation.opentelemetry.io/inject-nodejs: true -
Python:
instrumentation.opentelemetry.io/inject-python: true -
Go:
instrumentation.opentelemetry.io/inject-go: true
Note that the value of the annotation refers to the namespace and name of the Instrumentation resource that we created. Other options are:
-
"true" - inject and use the
Instrumentationcustom resource from the same namespace. -
"my-instrumentation" - name of an
Instrumentationcustom resource in the current namespace, use this if you have multipleInstrumentationresources in the same namespace. -
"my-other-namespace/my-instrumentation" - namespace and name of
Instrumentationcustom resource in another namespace. -
"false" - do not inject
When a pod with one of the annotations is created the operator modifies the pod via a mutation hook:
-
It adds an init container that provides the auto-instrumentation library
-
It modifies the first container of the pod to load the instrumentation during start up and it adds environment variables to configure the instrumentation
Application Collection only provides the instrumentation image for Go, for other languages the operator will fallback to the upstream Open Telemetry instrumentation images. To be able to pull the extra image the application that is going to be auto-instrumented must have the credentials to pull images from Application Collection.
Example for auto-instrumenting Alertmanager with Go auto-instrumentation.
kubectl run alertmanager --image quay.io/prometheus/alertmanager --port 9093 \
    --overrides='{"spec": {"imagePullSecrets":[{"name": "application-collection"}]}}' \
    --annotations=instrumentation.opentelemetry.io/inject-go=true \
    --annotations=instrumentation.opentelemetry.io/otel-go-auto-target-exe=/bin/alertmanager
View the results
Go to SUSE Observability and make sure the Open Telemetry Stackpack is installed (via the main menu -> Stackpacks).
After a short while and if your pods are getting some traffic you should be able to find them under their service name in the Open Telemetry -> services and service instances overviews. Traces will appear in the trace explorer and in the trace perspective for the service and service instance components. Span metrics and language specific metrics (if available) will become available in the metrics perspective for the components.
If you also have the Kubernetes stackpack installed the instrumented pods will also have the traces available in the trace perspective.
Rancher RBAC
For Rancher RBAC to work, telemetry data needs to have the following resource attributes present:
-
k8s.cluster.name- the Cluster name as used by the Kubernetes stackpack -
k8s.namespace.name- a Namespace managed by a Rancher Project
The collector will inject these attributes by default into any telemetry data that is sent with the example configuration that is provided.
Next steps
You can add new charts to components, for example the service or service instance, for your application, by following our guide. It is also possible to create new monitors using the metrics and setup notifications to get notified when your application is not available or having performance issues.
The operator, the OpenTelemetryCollector, and the Instrumentation custom resource, have more options that are documented in the readme of the operator repository. For example it is possible to install an optional target allocator via the OpenTelemetryCollector resource, it can be used to configure the Prometheus receiver of the collector. This is especially useful when you want to replace Prometheus operator and are using its ServiceMonitor and PodMonitor custom resources.